
Key Takeaways
- Performance attribution software decomposes benchmark-relative historical returns into modeled effects such as allocation, selection, and interaction, while broader portfolio comparison tools can evaluate performance alongside risk, diversification, taxes, fees, and holdings composition.
- The choice between Brinson-Hood-Beebower (BHB) and Brinson-Fachler (BF) attribution methodologies is not academic, it changes how allocation and selection effects are distributed in client-facing reports and investment discussions.
- Often the more consequential evaluation criteria are not feature lists but operational realities: data reconciliation with portfolio accounting systems, security classification consistency, and multi-asset class support.
- Firmwide attribution consistency depends more on centrally governed policies for benchmarking and data classification than on the software itself.
- Firms can evaluate whether embedded attribution capabilities are sufficient or if a dedicated tool is needed by assessing their requirements for methodology control, multi-period reporting options, and the level of analytical granularity their reporting demands.
For many advisory firms, the real question is not whether performance attribution matters. It is whether their existing reporting or portfolio accounting platform already provides sufficient attribution capabilities, or whether a dedicated attribution system is warranted.
Most firms first encounter attribution as an embedded feature within a broader reporting stack. Evaluating that capability well means looking beyond feature lists to understand methodology differences, data reconciliation requirements, and how attribution outputs will actually support client conversations and investment governance.
The quality of an attribution report depends as much on the consistency of upstream data and analytical workflows as it does on the attribution engine itself. For advisory firms, this means an effective evaluation process connects the software's capabilities to the firm's operational realities.
What Performance Attribution Software Does in Wealth Management
Investment performance attribution software decomposes a portfolio's return relative to a benchmark into modeled attribution effects to help investment professionals understand which decisions contributed to that relative performance. The most common framework decomposes returns into three primary components:
- Allocation Effect: Measures the impact of weighting sectors, asset classes, or other segments differently than the benchmark.
- Selection Effect: Measures the impact of choosing different securities within those segments compared to the benchmark's holdings.
- Interaction Effect: Captures the combined influence of both allocation and selection decisions (e.g., overweighting a sector in which your security selection also outperformed).
It is critical to distinguish the role of performance attribution from that of comparative portfolio analysis. Performance attribution analyzes benchmark-relative historical returns, decomposing realized performance into its component drivers. It answers the question, "What drove past performance relative to the benchmark?"
By contrast, comparative portfolio analysis is a broader portfolio comparison process. It can evaluate performance alongside risk exposures, diversification, fees, taxes, and holdings composition in order to compare an existing portfolio with a proposed approach or model. It answers a different question: "How does this portfolio compare with an alternative across the characteristics that matter to the conversation?"
Consider a hypothetical advisory team reviewing a client's equity portfolio that underperformed its benchmark by 150 basis points over a quarter. Attribution software would decompose that underperformance, showing, for example, that an overweight to a lagging sector contributed most of the shortfall. A comparative portfolio analysis tool would instead compare the portfolio's performance, risk profile, fee structure, diversification, and other characteristics against a proposed model to inform the next discussion.
While both serve advisory workflows, they answer different questions. Dedicated attribution tools like Bloomberg PORT, FactSet Portfolio Attribution, and SS&C Sylvan are common in institutional settings, while many wealth management platforms focus on broader comparative analysis to support acquisition and engagement.
How Brinson Attribution Methodologies Shape Interpretation
Most investment portfolio attribution software implements a version of the Brinson attribution framework. However, the specific methodology used, most commonly Brinson-Hood-Beebower (BHB) or Brinson-Fachler (BF), affects how allocation and selection effects are calculated and, therefore, how performance is interpreted. Firms evaluating attribution tools benefit from understanding this distinction, as it directly influences the narrative presented to clients and investment committees.
While both BHB and BF models produce the identical total active return, they differ in how they distribute that return between the allocation and selection effects. This is not a matter of mathematical accuracy but of interpretive philosophy. The choice determines how a firm explains its investment process.
BHB vs. BF: Where the Allocation Effect Diverges
The primary difference between the two models lies in how they calculate the allocation effect. In standard BHB, the segment allocation term uses the difference between portfolio and benchmark weights multiplied by the segment benchmark return. In standard BF, the allocation term uses that same weight difference multiplied by the segment benchmark return relative to the overall benchmark return. Because both formulas use the difference between portfolio and benchmark weights, neither produces a segment allocation effect when those weights are equal.
This can still lead to meaningful differences in reported segment-level results. Consider a hypothetical portfolio that underweights one sector relative to the benchmark in a quarter when that sector's benchmark return differs materially from the overall benchmark return. Under standard BHB and BF formulas, the individual segment allocation effects will differ in this scenario, even though the total allocation effect remains equal when portfolio and benchmark weights each sum to 100%.
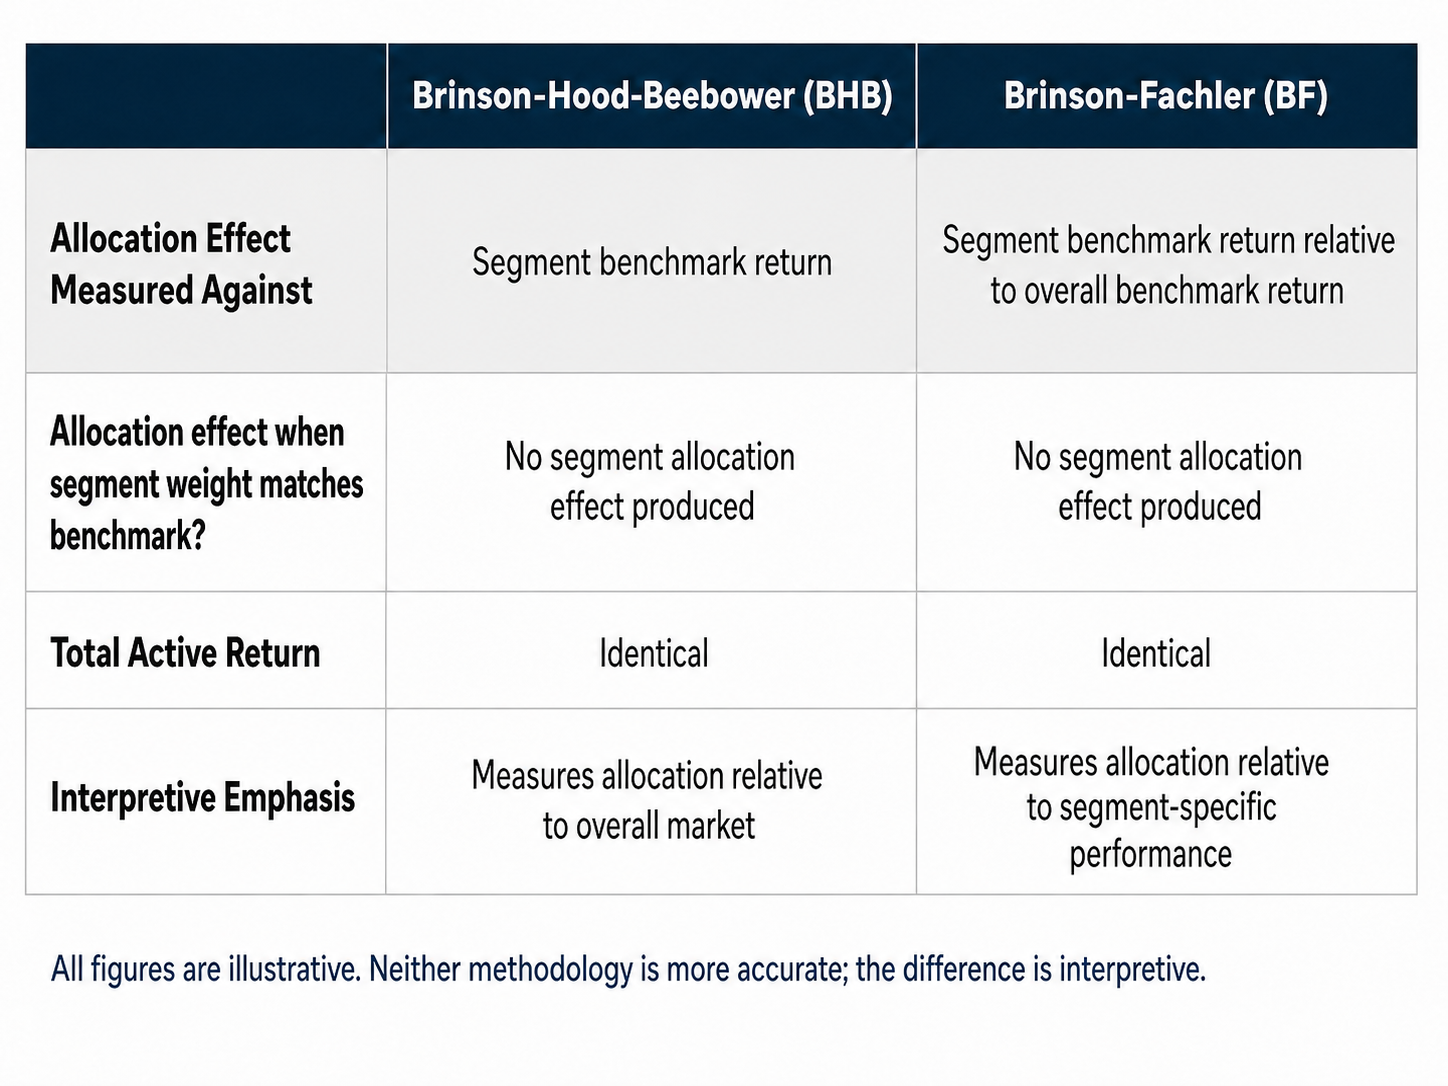
When evaluating investment performance attribution software, knowing which methodology the platform uses by default, and whether it allows for configuration between them, is a practical consideration for aligning reports with the firm's preferred interpretive framework.
Why Multi-Period Linking Methods Affect Longer-Horizon Attribution
Single-period attribution results, daily, weekly, or monthly, do not compound cleanly across longer time horizons. To aggregate results into quarterly or annual reports, software must use multi-period linking methods, typically classified as geometric or arithmetic.
This process often creates a "residual" or "linking effect," a portion of the total return that cannot be cleanly assigned to allocation, selection, or interaction when compounding across periods. Different platforms handle this residual differently. Some use smoothing algorithms to distribute it across the primary effects, while others report it as a separate line item.
The presence and size of this residual can complicate performance explanations. When evaluating portfolio attribution analysis software for reporting periods longer than a month, it is useful to ask how the platform handles multi-period linking and whether its approach is configurable. This is a common evaluation point for platforms like FactSet Portfolio Attribution and StatPro Revolution, now part of Confluence.
What to Evaluate When Selecting Attribution Software for an Advisory Firm
Feature lists and attribution model counts are often the focus of software demonstrations, but they can be insufficient evaluation criteria. The more consequential questions for advisory firms involve data quality, classification consistency, and integration with the firm's existing portfolio accounting infrastructure. A common operational consideration is that ongoing data reconciliation between the attribution engine and the portfolio accounting system can become a meaningful part of the total effort required to maintain reliable reporting.
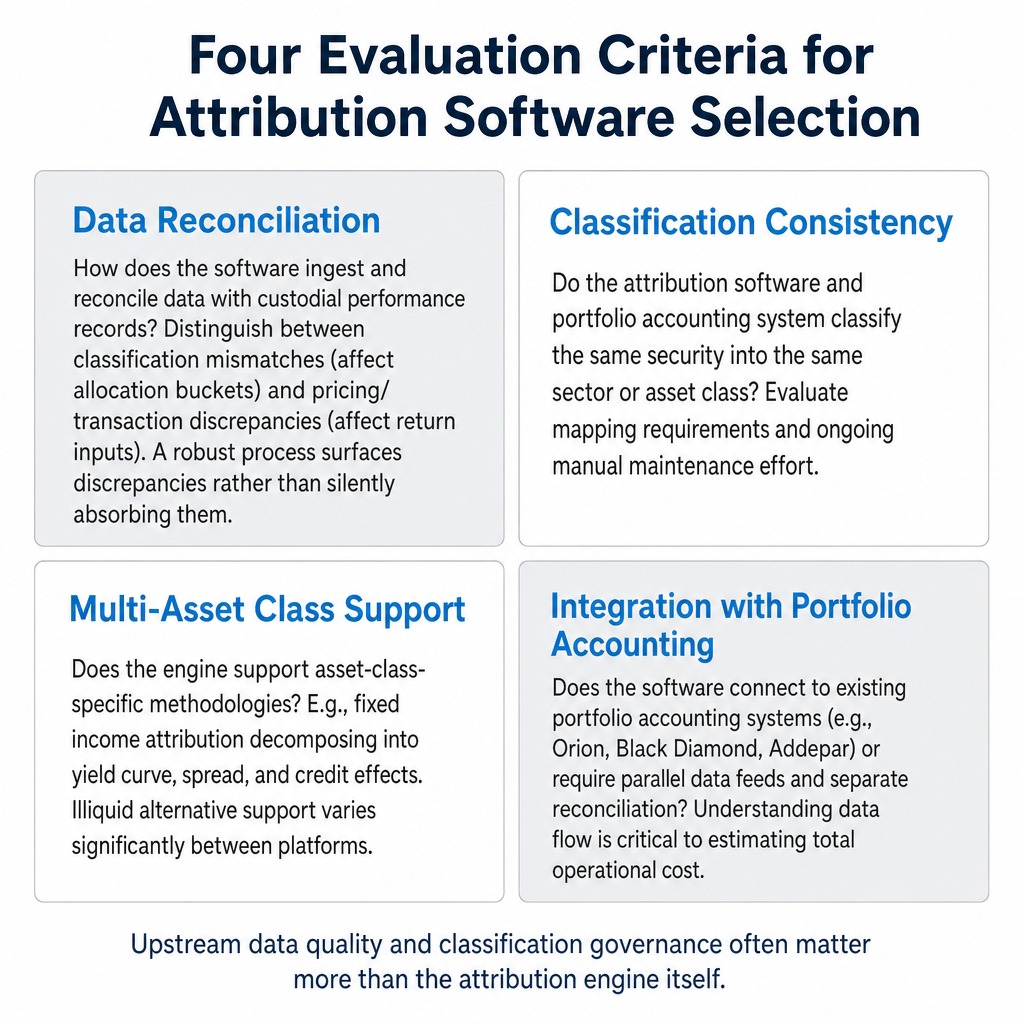
Here are four practical considerations for your evaluation:
- Data Reconciliation: Attribution results are only as reliable as the underlying returns and holdings data. Firms may want to evaluate how the software ingests and reconciles data with custodial performance records. It is important to distinguish between two common sources of error: classification mismatches affect which bucket a holding falls into for allocation calculations, while pricing or transaction-level discrepancies affect the return inputs themselves. A robust process surfaces these discrepancies rather than silently absorbing them.
- Classification Consistency: If the attribution software and the portfolio accounting system classify the same security into different sectors or asset classes, attribution results will diverge from standard performance reports. This creates confusion for both advisors and clients. An evaluation can include assessing how the software maps its classifications to the firm's existing scheme and how much manual effort is required to maintain consistency.
- Multi-Asset Class Support: Firms with portfolios that include fixed income, alternatives, or private capital may want to evaluate whether the attribution engine supports asset-class-specific methodologies. For example, some platforms offer dedicated fixed income attribution that can decompose returns into yield curve, spread, and credit effects. Support for illiquid alternatives often varies significantly between platforms.
- Integration with Portfolio Accounting: Does the attribution software connect to the firm's existing portfolio accounting system, such as Orion, Black Diamond by SS&C, or Addepar, or does it require parallel data feeds and a separate reconciliation process? Understanding the data flow is important when estimating the total operational cost.
Read more: RIA Tech Stack Architecture: The Workflow Layer Most Firms Overlook | VRGL
Factor-Based Attribution vs. Sector-Based Attribution: When Each Adds Value
As firms evaluate their analytical needs, they often encounter a choice between two distinct approaches to return decomposition: sector-based and factor-based attribution. The two methodologies answer fundamentally different questions.
Sector-based attribution, the more traditional approach for wealth management, decomposes returns by grouping holdings into segments like sectors, geographies, or asset classes. It then measures allocation and selection effects within those groups. This method is often intuitive for client conversations because most clients understand the concept of sector exposure.
Factor-based attribution decomposes returns based on a portfolio's exposure to systematic risk factors, such as value, momentum, size, quality, and low volatility. It can reveal performance drivers that sector analysis might miss. For example, a portfolio that appears diversified across sectors could be highly concentrated in a single factor exposure, a risk that factor analysis would surface.
However, factor-based attribution typically requires more sophisticated data inputs (like factor returns and security-level factor loadings) and can introduce a layer of complexity that may not be necessary for all client discussions. While many wealth management platforms default to sector-based Brinson attribution, specialized tools like Style Analytics and Bloomberg PORT offer advanced factor-based capabilities. The right choice depends on the firm's investment process and the analytical depth required for its target audience.
Approaching Firmwide Attribution Consistency Across Offices and Teams
For enterprise advisory firms with multiple offices, teams, or recently acquired practices, a common challenge is inconsistent attribution reporting. One team may use a different benchmark, another may use a different classification scheme, and a third may use a different attribution methodology altogether. The result is a set of reports that cannot be easily compared or aggregated at the firm level, undermining investment governance.
When CIOs and investment leadership evaluate portfolio performance attribution software for firmwide deployment, they may want to consider how the platform supports centralized governance. Key questions include whether the system allows for centrally managed benchmark definitions, firmwide classification mappings, and standardized methodology settings.
At the same time, many firms want to preserve team-level flexibility in how reports are configured and presented. Balancing central oversight with advisor autonomy is a familiar challenge in scaling advisory operations. Achieving firmwide attribution consistency is therefore a governance and data policy challenge first, supported by technology second. The goal is to establish a shared analytical baseline without forcing every advisor into an identical practice model.
When a Firm Needs Dedicated Attribution Software vs. Embedded Platform Capabilities
Many portfolio accounting, reporting, and all-in-one wealth management platforms now include some level of performance attribution functionality. This presents a practical question for growing firms: when are these embedded capabilities sufficient, and when is a dedicated attribution engine warranted?
The decision often comes down to the required level of analytical granularity and control.
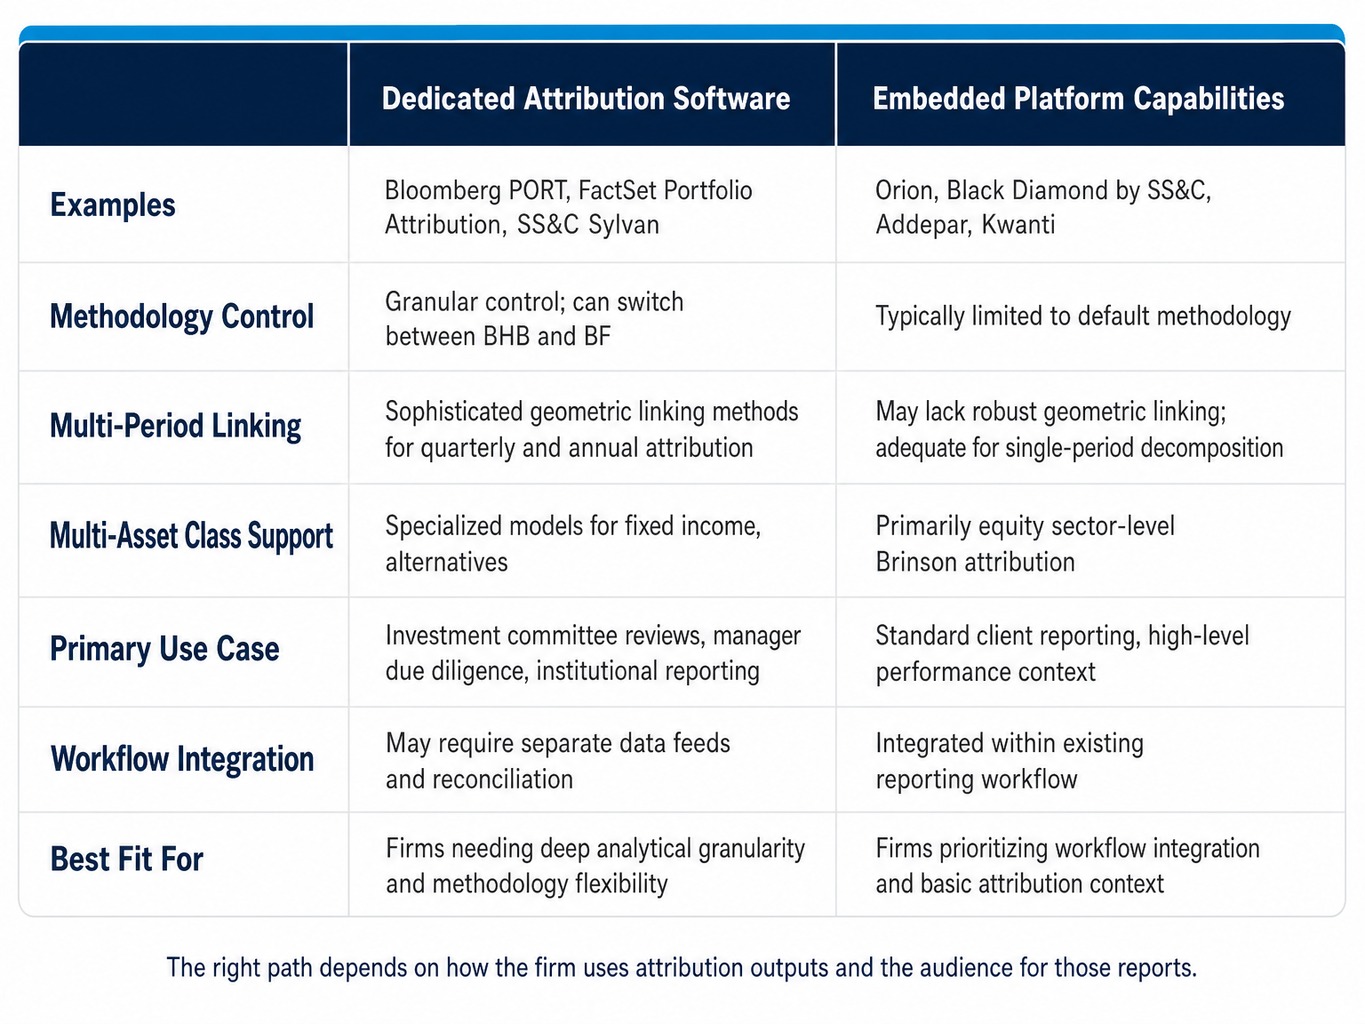
Dedicated attribution software (such as Bloomberg PORT, FactSet Portfolio Attribution, or SS&C Sylvan) is often a fit for firms that:
- Require granular control over methodology choices, such as switching between BHB and BF.
- Need more flexible options for multi-period attribution reporting.
- Manage complex fixed income or alternative investment strategies that may require specialized models.
- Use attribution primarily for detailed internal investment committee reviews and manager due diligence.
Embedded platform capabilities (such as those within Orion, Black Diamond, Addepar, or Kwanti) may be sufficient for some firms, but the analytical scope varies by platform, product tier, and configuration. Not all these systems provide equivalent Brinson attribution functionality. Where available, embedded features are generally a fit for firms that:
- Need basic, sector-level Brinson attribution for standard client reporting.
- Prioritize workflow integration over methodological flexibility.
- Use attribution to provide high-level performance context alongside broader comparative portfolio analysis.
Embedded modules can be appropriate for some single-period attribution needs, while dedicated tools may offer broader methodology and reporting flexibility in certain environments. The right path depends on how a firm uses attribution outputs, the audience for those reports, and the specific capabilities available in the products being evaluated.
Where Comparative Portfolio Analysis Complements Attribution Workflows
Performance attribution software is designed to answer the question, "What drove past performance?" However, many advisory firms find that the more frequent and pressing conversation with prospects and clients is about what to do next. This forward-looking discussion requires a different analytical lens, one that compares an existing portfolio with a proposed strategy across multiple dimensions.
This is where VRGL's Comparative Portfolio Analysis capabilities complement traditional attribution workflows. VRGL does not provide Brinson performance attribution. Instead, the VRGL Growth Platform supports analytical and presentation work that sits alongside it. Discovery and fact-finding remain with the advisor. Once portfolio data has been gathered, Statement Extraction can organize supported investment statement data, and Comparative Portfolio Analysis can evaluate holdings across performance, risk, diversification, taxes, and fees.
Advisors can use these objective insights to generate governed, branded reports that help communicate the rationale for their recommendations. For firms using dedicated attribution software for historical decomposition, VRGL can serve as a complementary layer by helping turn portfolio information into clear, client-ready materials that support acquisition and engagement conversations.
See how VRGL supports the acquisition workflow from data intake to client-ready presentation.
Clarifying Your Firm's Analytical Needs
Evaluating performance attribution software is less about comparing feature lists and more about understanding how methodology choices, data reconciliation, and integration shape the ultimate usefulness of the output. The upstream decisions, such as which methodology to use, how to classify securities consistently, and how to manage benchmark data, often matter more than the attribution engine itself.
As advisory firms assess their technology stack, understanding where historical attribution fits alongside forward-looking comparative portfolio analysis and risk analytics is key. This clarity can help firms decide which capabilities warrant dedicated software and which are better served by the integrated platforms that already drive their daily workflows.
This article is for informational purposes only and does not constitute investment, legal, tax, or compliance advice. All examples are illustrative.
Frequently Asked Questions
1. How does holdings-based attribution compare to returns-based attribution in practice?
Holdings-based attribution uses actual portfolio holdings and weights to decompose returns at the security or segment level, providing granular insight into allocation and selection effects. Returns-based attribution uses return series rather than full holdings data to estimate sources of relative performance through return-based methods. Some returns-based approaches are distinct from returns-based style analysis, which specifically infers style exposures through regression. Holdings-based attribution is generally more granular, while returns-based methods can be useful when holdings data is limited.
2. What role can performance attribution software play in GIPS compliance reporting?
Performance attribution is not generally a required component of GIPS compliance. However, attribution software may still support firms that choose to include attribution analysis within broader reporting or investment review processes. GIPS compliance itself is more directly concerned with areas such as performance calculation, composite construction, presentation standards, and related policies and procedures.
3. How are fee-adjusted returns typically calculated in attribution software?
Fee treatment depends on how a firm's performance measurement process is structured and on what the attribution engine is designed to consume or calculate. Some workflows import gross-of-fee and net-of-fee returns from a performance measurement system, while some platforms may support additional net-of-fee reporting calculations. Because performance measurement and performance attribution are related but distinct processes, firms may want to evaluate exactly where gross- and net-of-fee performance is calculated and how those returns flow into attribution reporting.
4. Can performance attribution software handle portfolios that include alternative investments?
Some attribution platforms support alternative asset classes, but coverage varies significantly. Liquid alternatives with daily pricing can typically be incorporated into standard Brinson attribution. Illiquid alternatives, such as private equity or real assets, often require different return calculation methodologies and may not fit cleanly into traditional attribution frameworks. Firms with meaningful alternative allocations may want to evaluate platform-specific capabilities.
5. What are common implementation challenges when deploying attribution software at scale?
Common challenges include establishing consistent security classification mappings across the firm, reconciling attribution data feeds with portfolio accounting systems, training investment teams on methodology interpretation, and managing the ongoing maintenance of benchmark definitions. Firms that underestimate these data governance requirements often find that attribution outputs are difficult to trust or compare across teams.